To understand the strategies that states undertake to expand coverage and initiate broader health reform, it is important to recognize the variability in states’ health coverage distribution, employer-sponsored insurance rates, and public program eligibility levels. The charts below highlight certain aspects of Missouri's coverage landscape. The graphs also provide a comparison to national data to give a sense of how Missouri is faring.
For more information on specific coverage programs implemented in this state, please click on the ‘Coverage Strategies’ tab.
Overview of Medicaid and SCHIP Coverage[1]
Group | Income Eligibility |
| 185% FPL (ages 0-1) 150% FPL (ages 1-18)(Title XIX/SCHIP Expansion) 300% FPL (SCHIP) |
Pregnant Women | 185% FPL |
Parents/Caretakers | with income that does not exceed the July 16, 1996 Aid to Families with Dependent Children (AFDC) income standards |
Permanently Totally Disabled/Aged | 85% FPL |
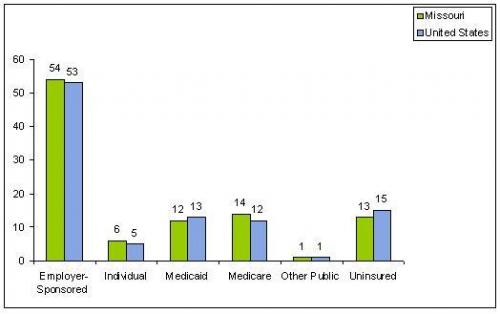
Sources of Health Insurance Coverage State Data 2006 – 2007, U.S.[3]
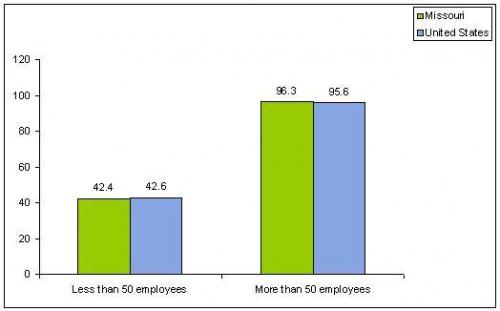
Percentage of Private-Sector Establishments That Offer Health Insurance Based on Firm Size by State, 2005[4]