Uninsured in America: The Facts
![]()
Number and Percent of Uninsured Decreases[i]
- The total number of uninsured decreased in 2007 to 45.7 million from 47 million in 2006. The percentage of uninsured also decreased from 15.8 percent to 15.3 percent.
- This is only the fourth time since 1994 that an increase in health insurance coverage among the non-elderly population has been recorded.
- Despite this increase, the percent of people covered by private health insurance decreased from 67.9 percent in 2006 to 67.5 percent in 2007.
- Rates of uninsurance continue to differ significantly across the country. On a regional level, the Midwest and Northeast had the lowest rates of uninsurance (11.4 percent for each), followed by the West (16.9 percent), and the South (18.4 percent). States with the lowest uninsurance rates include Hawaii (8.3 percent), Massachusetts (8.3 percent), and Minnesota (8.5 percent), while states with the highest rates of uninsurance rates include Texas (24.4 percent), New Mexico (21.9 percent), and Florida (20.5 percent).
- Nine states had statistically significant increases in uninsurance: Kansas, Kentucky, Louisiana, Nebraska, New Jersey, New Mexico, New York, North Carolina, and Texas.
- Five states showed statistically significant decreases in uninsurance: Connecticut, Indiana, Massachusetts, West Virginia, and Wisconsin, as did the District of Columbia. Massachusetts alone accounted for 22 percent of the decline in nonelderly uninsured.[i]
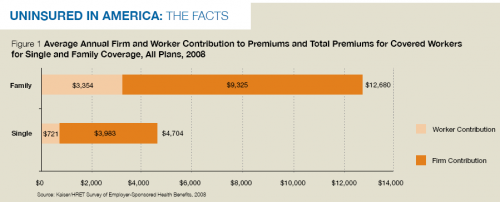
Figure: Average Annual Firm and Worker Constribution to Premiums and Total Premiums for Covered Workers for Single and Family Coverage, All Plans, 2008
Employer Offer Rates Level Off in 2008 after Long Decline[ii]
- In 2008, 63 percent of employers offered health benefits to their employees, although this is not statistically different from the 60 percent of employers who offered coverage in 2007. This is down from 69 percent in 2000.
- Employer-sponsored coverage varies dramatically by firm size. Nearly all (99 percent) of large firms with 200 or more employees offered coverage, but only 49 percent of firms with three to nine employees did so.
- Firm size is not the only factor that affects whether an employer offers coverage. Firms with no union workers as well as those with a higher proportion of lower-wage workers (defined as a firm where more than 35 percent of workers earn less than $22,000 annually) are less likely to offer coverage.
Rise in Public Program Enrollment
- More people were covered by Medicaid in 2007. The percentage of people covered by Medicaid increased to 13.2 percent from 12.9 percent in 2006.[iii]
- Much of the increase in health insurance coverage can be attributed to an increase in the number of people covered by government programs. The number of people enrolled in these programs increased from 27 percent in 2006 to 27.8 percent in 2007.
Health Insurance Premiums Go Up, Move Toward High Deductible Health Plans[iv]
- Since 1999, health premiums have increased a staggering 119 percent. That is more than three times the rate of increase in employee wages (34 percent), and is more than four times the rate of increase in inflation (29 percent) over the same period of time.
- Health insurance premiums continued to increase in 2008, rising 5 percent in 2008. The average annual premium for single coverage in 2008 was $4,704 and the average annual premium for family coverage was $12,680.
- Workers with both single and family coverage paid for a significant share of their premiums. Single coverage workers paid more than 15 percent and family coverage workers paid more than 26 percent of their health insurance premiums. There was significant variation within this group, with more than one-fifth of single coverage workers and 47 percent of family coverage workers paying more than 25 percent of their premium.
- While the rise in health insurance premiums was relatively modest, more employers are turning to health plans with high deductibles and fewer benefits to keep premiums down. The percentage of workers enrolled in high-deductible insurance plans (defined as having a deductible of $1,000 or more) jumped from 12 percent in 2007 to 18 percent in 2008. Among firms with 3 to 199 employees, the rate more than doubled from 16 percent to 35 percent.
- Increasingly, these high-deductible plans are being coupled with a health savings account, where an employee (and employer, if so inclined) can set aside a portion of their income on a pretax basis and then use that to cover qualified medical expenses. In 2008, 13 percent of employers offered plans with a savings option. While this does not differ statistically from the 10 percent that offered last year, it is significantly greater than the 7 percent of employers that offered them in 2006.
Continue reading on: Who are the Non-Elderly Uninsured?
[i] DeNavas-Walt, C.et al. Income, Poverty, and Health Insurance Coverage in the United States: 2007, U.S. Census Bureau, Current Population Reports, Washington, DC: U.S. Government Printing Office, 2008, pp. 60-235.
ii Holahan, J. and A. Cook. "The Decline in the Uninsured in 2007: Why Did It Happen and Can It Last?" Kaiser Commission on Medicaid and the Uninsured, October, 2008.
[ii] Unless otherwise noted all data taken from “Employer Health Benefits Annual Survey, 2008,” Kaiser Family Foundation and Health Research Education Trust, September 2008.
[iii] DeNavas-Walt, C. op. cit.
[iv] “Employer Health Benefits Annual Survey, 2008,” Kaiser Family Foundation and Health Research Education Trust, September 2008.
[i] DeNavas-Walt, C. op. cit.