![]()
To understand the strategies that states undertake to expand coverage and initiate broader health reform, it is important to recognize the variability in states’ health coverage distribution, employer-sponsored insurance rates, and public program eligibility levels. The charts below highlight certain aspects of Vermont's coverage landscape. The graphs also provide a comparison to national data to give a sense of how Vermont is faring.
For more information on specific coverage programs implemented in this state, please click on the ‘Coverage Strategies’ tab.
Overview of Medicaid and SCHIP Coverage[1]
Group | Income Eligibility |
Children | 300% FPL (ages 0-18) |
Pregnant Women | 200% FPL |
Parents | 185% FPL 200% FPL (Premium Assistance only)[2] |
Childless Adults | 150% FPL 200% FPL (Premium Assistance only)2 |
SSI Disabled | 100% FPL[3] |
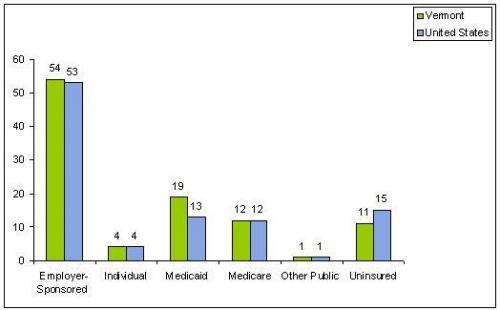
Sources of Health Insurance Coverage State Data 2006 – 2007, U.S.[4]
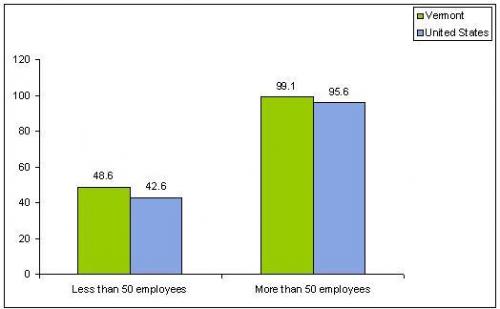
Percentage of Private-Sector Establishments That Offer Health Insurance Based on Firm Size by State, 2006[5]
[1]This overview provides a general description of state coverage levels under their Medicaid and SCHIP programs, including coverage through waivers, as of December 2008. Eligibility information was gathered from state web sites, data from state reports, and verified through contacts with CMS and state officials during the fall of 2008. This does not reflect the specific eligibility categories or requirements. This is not intended to be a substitute for eligibility information provided by each state. Individuals interested in applying for these programs should contact the state directly for specific eligibility requirements.
[2]While federal coverage is extended to 200 percent of the FPL, the state is using state-only funds to support coverage to 300 percent of the FPL.
[3]Non-elderly SSI Disabled – $883/month for one -person households (100% FPL) and $1055 for two-person households (90% FPL)
[4]Urban Institute and Kaiser Commission on Medicaid and the Uninsured estimates based on the Census Bureau’s March 2007 and 2008 Current Population Survey.
[5]Agency for Healthcare Research and Quality, Center for Financing, Access and Cost Trends. 2006 Medical Expenditure Panel Survey-Insurance Component.
State Profiles